Further Exploration: Can NFL career success be predicted based on Combine results?
Last week, we failed to find any strong correlations between Combine results and CareerAV (Career Approximate Value). We realized that CareerAV may not be the best way to quantify “success,” especially since it compares athletes across different positions. Thus, this week we investigated whether we could use Combine results to predict position-specific career metrics (e.g. tackles per season for linebackers, passing yards per season for quarterbacks).
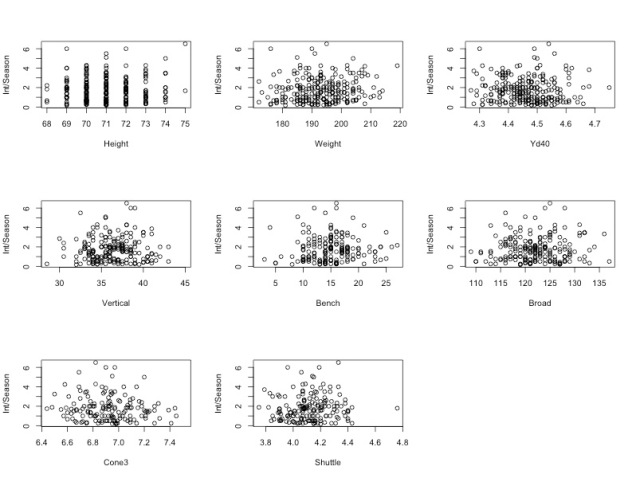
We failed to find notable correlations for any position. Below is one example set of scatterplots. It plots cornerbacks’ interceptions per season vs. Combine results.
Is there a significant difference in career success between NFL players who participated in the Combine and NFL players who did not?
Each year, approximately 250 athletes are selected in the NFL draft. Out of these 250, approximately 215 were invited to the Combine a few months beforehand. We hypothesized that the Combine participants would get picked earlier and go on to have greater success in the NFL.
From our Combine and draft data from 1999-2015, there were a total of 3620 drafted players who attended the Combine and 712 drafted players who did not attend.
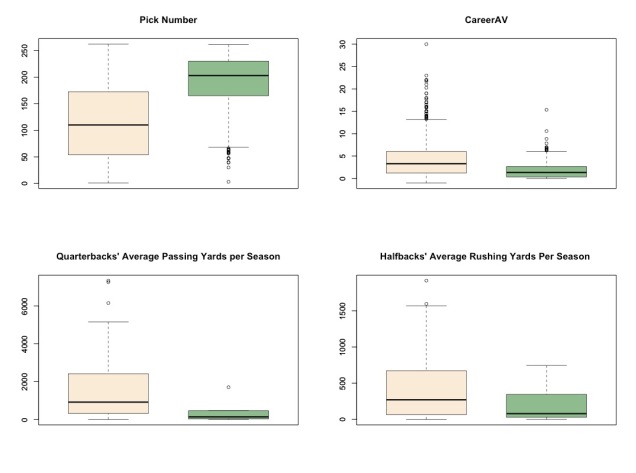
Note: in all the charts above, Combine participants are represented by the beige boxplots, while non-participants are represented by the green boxplots
From these plots, we could see that Combine participants were generally picked earlier in the draft and went on to have better career success, measured both in terms of CareerAV and position-specific metrics. Another notable finding was that all of the NFL “superstars” (represented by the highest outliers) were Combine participants.
These trends suggest that for an individual player, simply getting invited to the Combine, rather than performance at the actual event, is a good predictor of draft pick and career achievement. However, it is also important to note that Combine attendance does not guarantee success, since each year, there are approximately 125 athletes who attend the Combine but do not get drafted.
Can NFL career success be predicted based on draft results?
In last week’s exploration, we also found that Combine results did not seem to be correlated with draft pick or CareerAV. However, draft pick did seem to be correlated with CareerAV:
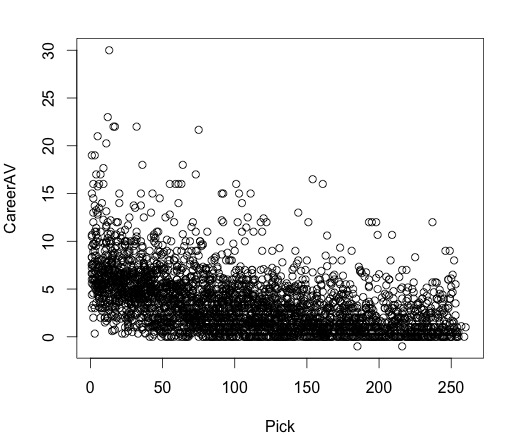
From this scatterplot, we could see that generally, players drafted earlier tend to have better performance in the NFL.
This week we wanted to determine whether players drafted earlier would have better career performance measured not only by CareerAV, but also by position-specific metrics.
After creating scatterplots for multiple position-specific metrics vs. pick number, we found that earlier picks did tend to have stronger NFL stats. We include two scatterplots as example evidence:
This first graph plots cornerbacks’ average tackles per season vs. pick number.

This second graph plots linebackers’ average sacks per season vs. pick number.

From this exploration, we found that draft pick could be used to predict career success (measured by either CareerAV or position-specific career metrics). However, neither CareerAV nor position-specific career metrics correlate with Combine results. These findings suggest that although teams pick players strategically during the draft, the pick order is not highly influenced by Combine results. We expect that when teams draft players, college performance is a more important factor.
Draft Pick Valuation
We decided to explore the correlation between CareerAV per season and draft pick number further by assigning each pick number a “value” based on how well players drafted in that position have historically done compared to those drafted before and after them.
The most famous draft pick valuation was done by Cowboys’ coach Jimmy Johnson in the 1990s to help his team decide how to properly evaluate trades involving draft picks. For example, he valued the #1 overall pick at 3000. This means that under his system, trading away the #1 pick requires a return draft picks whose total value is greater than or equal to 3000 (for example, the third overall pick valued at 2200 grouped with the twentieth overall pick valued at 850 – a trade with a net of +50 value).
It must be noted that Coach Johnson did not use any rigorous statistics to support his pick valuation. Indeed, his valuation has been heavily critiqued since then, and thus we decided to compare our results to his and see if we agree with the critics.
First, we grouped together players by draft pick number, and averaged the CareerAV per season across all players in each group. We did not include players drafted in 2015 or 2016, since there is not yet enough data to infer how well they will perform in the NFL. Thus, for most pick numbers, we had 16 players drafted in that position in the years between 1999 and 2014.
When analyzing any type of sports data, sample bias is very important to consider. Better players are given more playing time and thus accumulate better metrics to measure the value they add to their team. This leads to a non-representative sample from the population of NFL players as worse players who are given less to no playing time are under-represented. In order to take into account players who did not last an entire season in the NFL – an important group of draft “busts” that must be represented – we give them a CareerAV per season of 0 to indicate the absence of value added to their team.
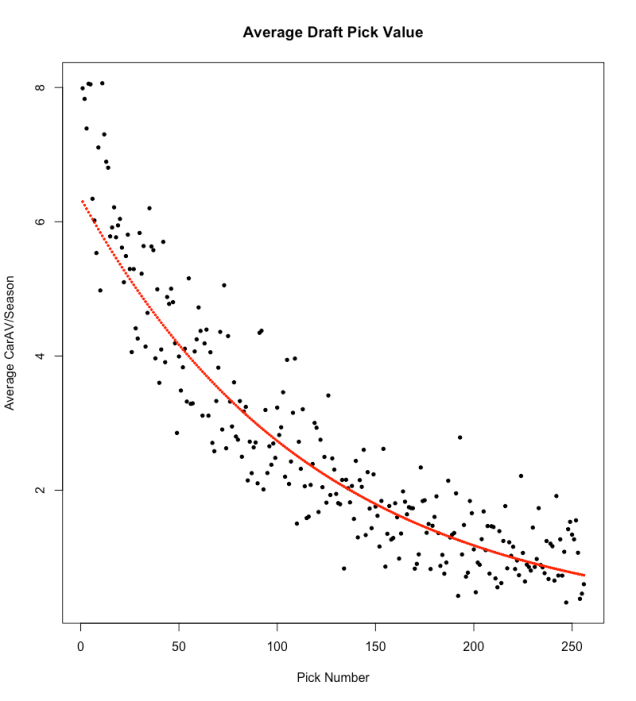
Here we plotted the Average Career AV per Season for each individual pick number across the 16 drafts in our dataset. A non-linear inverse relationship is evident in the scatter plot. Using a log transformation of the dependent variable, we ran a linear regression to find the best-fit line through these points. This yielded a statistically significant model where a substantial 81.2% of the variation in the log(Average Career AV per Season) was predictable by Pick Number.
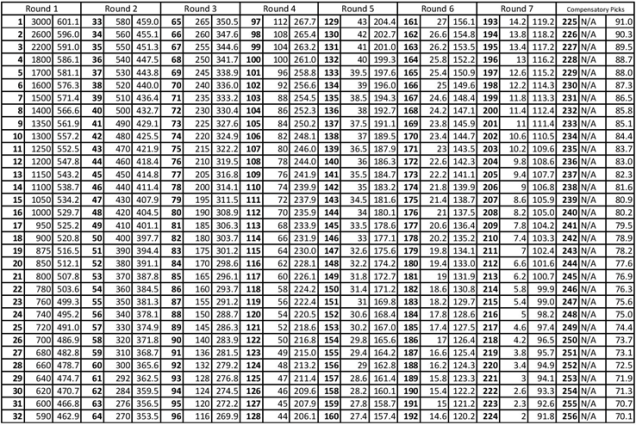
We then used this model to generate a new valuation of each pick position in a draft and compared this to Jimmy Johnson’s original values. In the following chart, for each round of draft picks, the first column is the pick number, the second is Jimmy Johnson’s valuation of that pick, and the third is our valuation. To facilitate comparison, we scaled our values so that the sum of picks 1 to 224 was equal between the two systems.
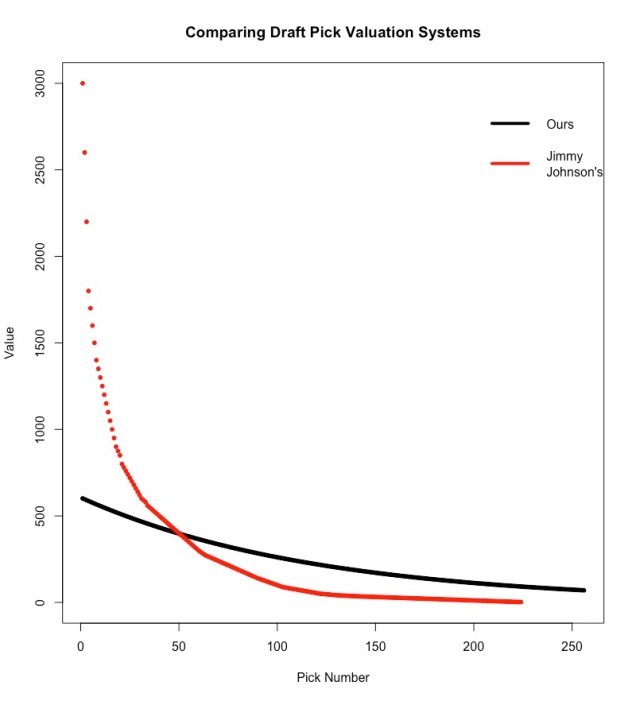
It is evident that Jimmy Johnson severely overvalued early picks and also undervalued later picks. In addition, our findings confirm the hypothesis that teams do draft better players earlier, perhaps based on college performance or other traditional scouting methods.
Bonus: An added twist to the last visualization
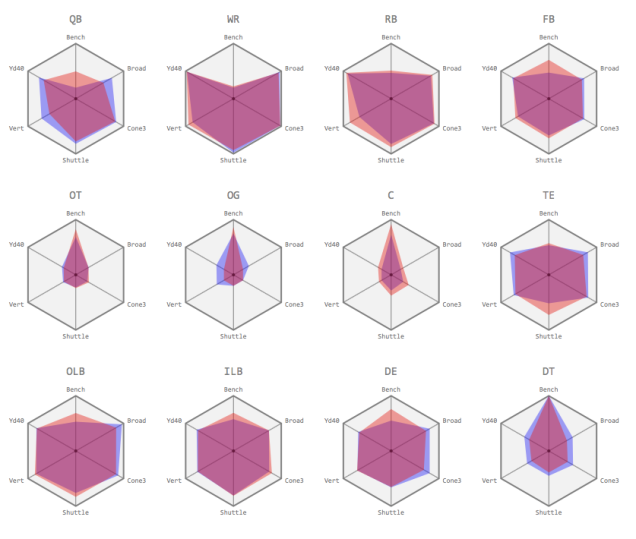
See our last post for details on how to read the above visualization. In the graphic above, blue shapes represent average player stats while red shapes indicate top player stats.
Group Members: Caroline Malin-Mayor (cmalinma), Monica-Ann Mendoza (momendoz), Tyler Devlin (tddevlin), Victor Li (vcli)
