Question 1: Can NFL career success be predicted based on Combine results?
The primary goal of our project is to determine whether NFL career success can be predicted based on Combine results. To quantify success, we are using a player’s Weighted Career Approximate Value divided by number of seasons played – we will refer to this metric as CareerAV. CareerAV is a continuous variable, and higher values correspond to greater success.
The Combine includes the following information about a player: height, weight, 40-yard dash time, vertical jump, bench press, broad jump, 3-cone drill time, and shuttle run time. We hoped to use these features (either all or a subset) in linear regression in order to predict a player’s future CareerAV.
To determine whether we could build an accurate prediction model, we began by investigating correlations between each attribute and CareerAV. The scatterplots below reveal that there were no clear relationships. Numerical measures of correlations ranged from -0.15 to 0.12, suggesting that there were no linear associations.

Despite our scatterplot and correlation results suggesting that there were no predictable trends, we investigated what would result if we built a multiple regression model nevertheless.
This is the output of our R code to create a model involving all physical metrics.

The low R-squared value indicates that our regression model was a poor fit, as expected. It was only able to predict 4% of the variation in CareerAV. Additionally, although some of our coefficient estimates were statistically significant, we doubt their accuracy, since some suggested that worse Combine performance (i.e. slower 40-yard dash and 3-cone drill times) would lead to better CareerAV.
Overall, we did not find evidence that Combine performance could accurately be predicted by Combine results using linear regression.
Question 1a: After grouping players by position, can NFL career success be predicted based on Combine results?
We hypothesized that we might be able to build more accurate regression models once we grouped athletes by position, since the importance of certain physical traits differs across roles (e.g. agility more crucial for wide receivers, strength more crucial for linemen).
This investigation also yielded negative results: there were no strong linear trends between Combine results and CareerAV, so regression models were inappropriate.
Question 2: Can NFL draft pick be predicted based on Combine results?
Our other primary question was whether we could predict NFL draft pick using Combine results. A scatterplot of CareerAV vs. Pick suggested that there was potentially a weak inverse relationship.

Because the Combine serves as a scouting camp for NFL draft prospects, we presumed that stronger performers in the Combine would get drafted earlier. However, the data did not support our expectation:
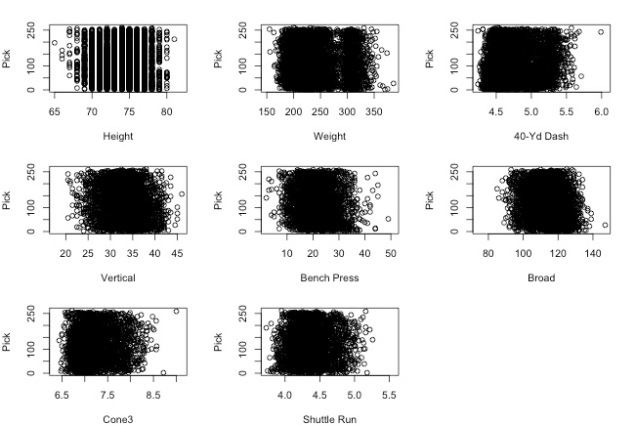
These scatterplots suggested that Combine results did not have a strong impact on draft picks. There was a relatively uniform distribution of pick numbers across all levels of Combine performance.
Question 2a: After grouping players by position, can Combine results predict when a player will be drafted in the Draft?
We again tried to see if analyzing positions separately would allow us to make better predictions. However, Combine results and pick numbers remained uncorrelated.
Question 3: What is the “shape” of an NFL player? (D3 Visualization)
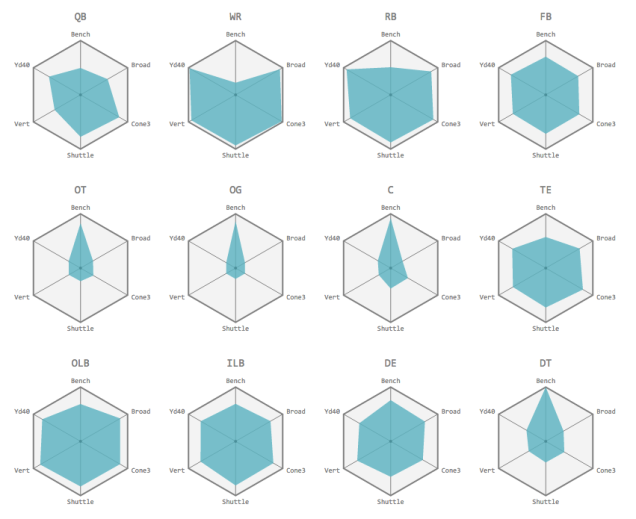
In the visualization above (click to see the entire thing), we sought to determine how different positions varied in their performance on Combine drills. The six points of each hexagon represent six different Combine measurements. The six points of the blue polygon represent the average performance of players from a given position on each drill. Better performance is indicated by a more expansive polygon. Here are some interesting things we noticed:
- Wide receivers and cornerbacks have very similar shapes. This is interesting because a cornerback’s primary role is to guard wide receivers.
- Free safeties also have similar shapes because their primary role is to guard receivers as backup for cornerbacks.
- Strong safeties and free safeties play similar roles, but strong safeties have the additional task of helping out with run defense which could explain their slightly higher bench performance.
- Some positions are less specialized, i.e. closer to a regular hexagon. Fullbacks, tight ends, and outside/inside linebackers all have fairly balanced measurements. This agrees with their roles on the field, since they all have to be good at multiple things.
- Finally offensive linemen and defensive tackles mostly need to be really strong, which explains their “pointy” shape.
Question 4: In the NFL draft, are some positions valued more than others?
We hoped to determine whether certain positions were in higher demand from teams during the draft. If that hypothesis were true, we would expect to see certain positions having earlier pick numbers overall.
These boxplots revealed that teams tended to pick long snappers (LS), kickers (K), and punters (P) in later rounds of the draft. This makes sense given the specialized nature of the positions and how few roster spots are given to them. Otherwise, there was little notable variation in Pick number across positions. There was not a sizable difference between skill positions (QB-quarterback, RB-running back, WR-wide receiver), and non-skill positions.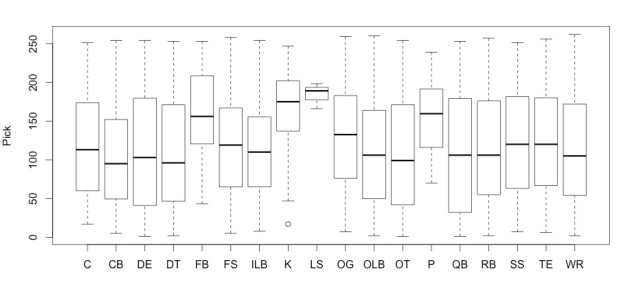
Question 5: Is there a difference in Combine performance between athletes who were drafted and those who were not?
Not all athletes who participate in the Combine get drafted later in the year. Thus, we wanted to determine whether poor performers in the Combine would be less likely to get drafted. However, once we split our dataset into drafted vs. non-drafted players, we did not see large differences in performance between the two groups:
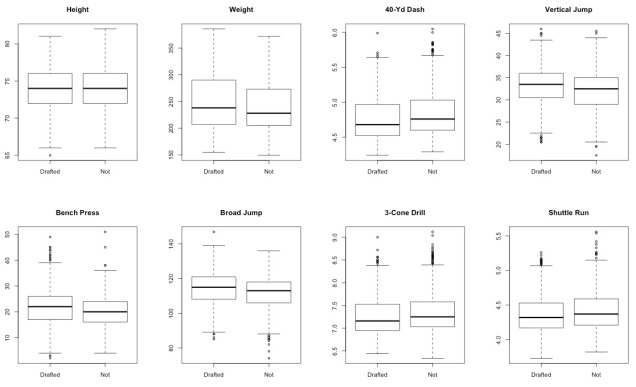
Thus, we believe that other factors played a larger role in determining whether a player was drafted. For example, an athlete’s college performance could more likely be an influential predictor.
For next week, we plan on investigating whether we can run a machine learning algorithm that can better differentiate between drafted and non-drafted athletes.
Overall Conclusions
This initial exploration casts some doubt into how useful the NFL Combine actually is to evaluate college prospects. There is more analysis to be done to further examine the standalone utility of the NFL Combine.
Next Steps
We failed to predict CareerAV based off of Combine performance. We realize, though, that CareerAV may not be the best measure of a player’s “success.” Thus, we would like to investigate whether we can predict position-specific career metrics (e.g. career sacks, career interceptions, career touchdowns, etc.).
We also plan on determining whether some teams value the Combine more than others. In that case, when examining certain teams individually, we would see correlations between Combine performance and Pick number.
Additionally, we hope to explore whether there is a significant difference between NFL players who attended the Combine and those who did not (each year, only a fraction of drafted players were invited to the Combine beforehand).
Group Members
Caroline Malin-Mayor (cmalinma)
Monica-Ann Mendoza (momendoz)
Tyler Devlin (tddevlin)
Victor Li (vcli)