Data Scraping, Cleaning, Integration
In this first week of the project we focused on scraping, cleaning, and integrating relevant data from our sources. We then also defined the scope of our investigation, namely by figuring out what is the best metric to use to measure an NFL player’s career “success”, regardless of position. Lastly, we begin some basic exploratory analysis on our data.
The first dataset we retrieved contains data from the NFL Combine workouts of every player who participated from 1999-2015. The specific variables include:
- Player Name
- Position
- School
- Height (inches)
- Weight (pounds)
- 40 Yard Dash Time (seconds)
- Vertical Jump (inches)
- Bench Press Repetitions at 225 pounds (repetitions)
- Broad Jump (inches)
- 3 Cone Drill (seconds)
- Shuttle Run (seconds)
- Team Drafted by
- Draft Round
- Overall Pick Number
- Draft Year
NFL Combine data from 2000-2015 was scraped from http://www.pro-football-reference.com/play-index/nfl-combine-results.cgi. This involved copy/pasting each individual year’s Combine results into a text file, which luckily yielded tab-separated values.
- Using R, we then cleaned the 2000-2015 data in the following manner. For a given year, we:
- Converted the file into comma-separated values
- Deleted unnecessary headers (header row was repeated a few times in the values)
- Converted height from “feet-inches” string format into an integer of total height inches
- Deleted an unnecessary column of hyperlinks for “College Stats”
- Converted the single column of “Team / Round / Pick Number / Year” into four separate columns
- Cleaned the “Round” column from string format into integer format (e.g. “4th” into “4”)
- Cleaned the “Pick Number” column in a similar fashion (e.g. “204th pick” into “204”)
- Appended this clean year-specific .csv to the master .csv that eventually contained clean Combine data from 2000-2015
To add the 1999 NFL Combine data (the oldest we could find), we used Daren Willman’s dataset from his website, http://nflsavant.com/index.php. Luckily, his data was already formatted well. Using R, we simply extracted the relevant columns that matched up with our 2000-2015 dataset and appended it to our master .csv to complete our first full dataset of NFL Combine data from 1999-2015.
Our second dataset is all players who were drafted in the 1999-2015 NFL Drafts with their draft position (team, round, pick number) and their NFL career statistics that can help us measure how successful a player was in the league. We retrieved this data from http://www.pro-football-reference.com/draft/, year-by-year from 1999-2015. For a given year, we downloaded the .csv of draft results and cleaned it in R as follows:
- Deleted unnecessary headers (header row was repeated a few times in the values)
- Renamed some headers for clarification purposes (e.g. Passing Yards vs. Rushing Yards)
- Deleted an unnecessary column of hyperlinks for “College Stats”
- Appended this clean year-specific .csv to the master .csv that eventually contained NFL Draft data from 1999-2015 for our complete second dataset
Our second dataset of NFL Draft data includes the following variables:
- Draft Year
- Round
- Overall Pick Number
- Team Drafted by
- Player Name
- Position
- Age
- Most Recent Year Played in NFL
- All-Pro 1st Team Selections
- Pro Bowl Selections
- Number of Years as Primary Team Starter
- Weighted Career Approximate Value
- Cumulative Approximate Value for Drafting Team
- Career Games Played
- Career Passing Completions
- Career Passing Attempts
- Career Passing Yards
- Career Passing Touchdowns
- Career Passing Interceptions
- Career Rushing Attempts
- Career Rushing Yards
- Career Rushing Touchdowns
- Career Receptions
- Career Reception Yards
- Career Reception Touchdowns
- Career Tackles
- Career Defensive Interceptions
- Career Sacks
- School
However, not all players who were drafted in those years participated in the Combine, and not all players who participated in the Combine were drafted into the NFL. Thus, we had to match the players’ combine statistics to their Draft and career data.
In order to do this, we imported the data into Microsoft Excel, and wrote a macro to integrate the two datasets. Essentially, the macro performed a left outer join on the NFL Combine dataset with the NFL Draft dataset, matching on draft year and overall draft pick number. Specifically, we used two nested for loops; the first went through all the players in the combine and selected their draft year and overall draft pick number, while the inner loop went through all the draft data looking for an entry with matching draft year and overall draft pick number. When a match was found, the macro added the data from the draft table to the combine entry for the player and broke out of the inner for loop, moving onto the next combine entry. The result was a table with 3,795 players who participated in the Combine and were subsequently drafted, along with 1,806 players with only Combine data who were never drafted.
Preliminary Exploration of “Success” Metric
As far as defining a metric for an NFL player’s career “success”, we have tentatively planned to use Weighted Career Approximate Value divided by Number of Seasons Played. Approximate Value (AV), is an advanced metric that measures the value a specific player adds to their team. It is meant to be used as a quick approximation of a player’s skill level and contributions when on the field. The higher a player’s AV, the better. The following scale provides a rough sketch of what AV translates into:
- Bust: AV < -25
- Poor: -24 < AV < -15
- Disappointing: -14 < AV < -5
- Satisfactory: -4 < AV < +4
- Good: +5 < AV < +14
- Very Good: +15 < AV < +24
- Excellent: AV > +25
Source: https://codeandfootball.wordpress.com/tag/approximate-value/
Weighted Career Approximate Value is a weighted sum of a player’s AV by season over their career – a sum that is 100% of their best season, 95% of their second-best season, 90% of their third-best, etc., which heavily favors players who may have a few outstanding seasons among some mediocre ones over a player’s consistent performance over multiple seasons. Dividing this by seasons played then allows for players who have played different numbers of seasons to be easily compared. We will continue to research this metric’s pros and cons and evaluate whether or not this is a suitable measure of success to attempt to predict with NFL Combine results. We may also need to determine some threshold of games played or seasons played to ensure reasonable results.
Preliminary Exploratory Analysis
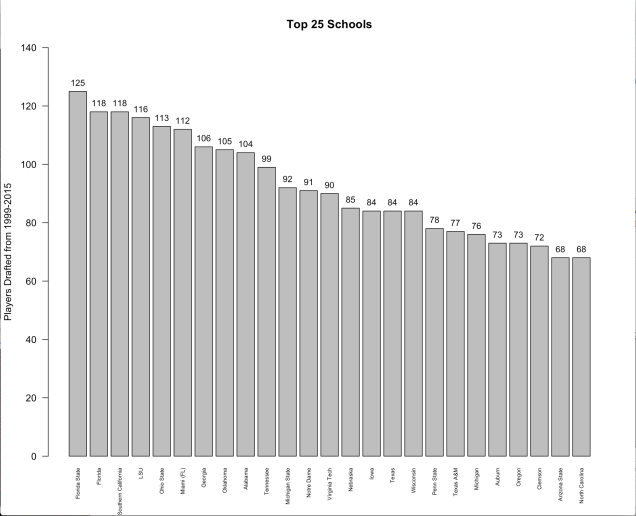
To wrap up the week, we began some exploratory analysis on our full dataset. One of the more interesting finds is detailed in the bar plot below, of the Top 25 schools who produced the most drafted players from 1999-2015.
Group members: Caroline Malin-Mayor (cmalinma), Monica-Ann Mendoza (momendoz), Victor Li (vcli), Tyler Devlin (tddevlin)
